Mei Siew Data Viz Blog
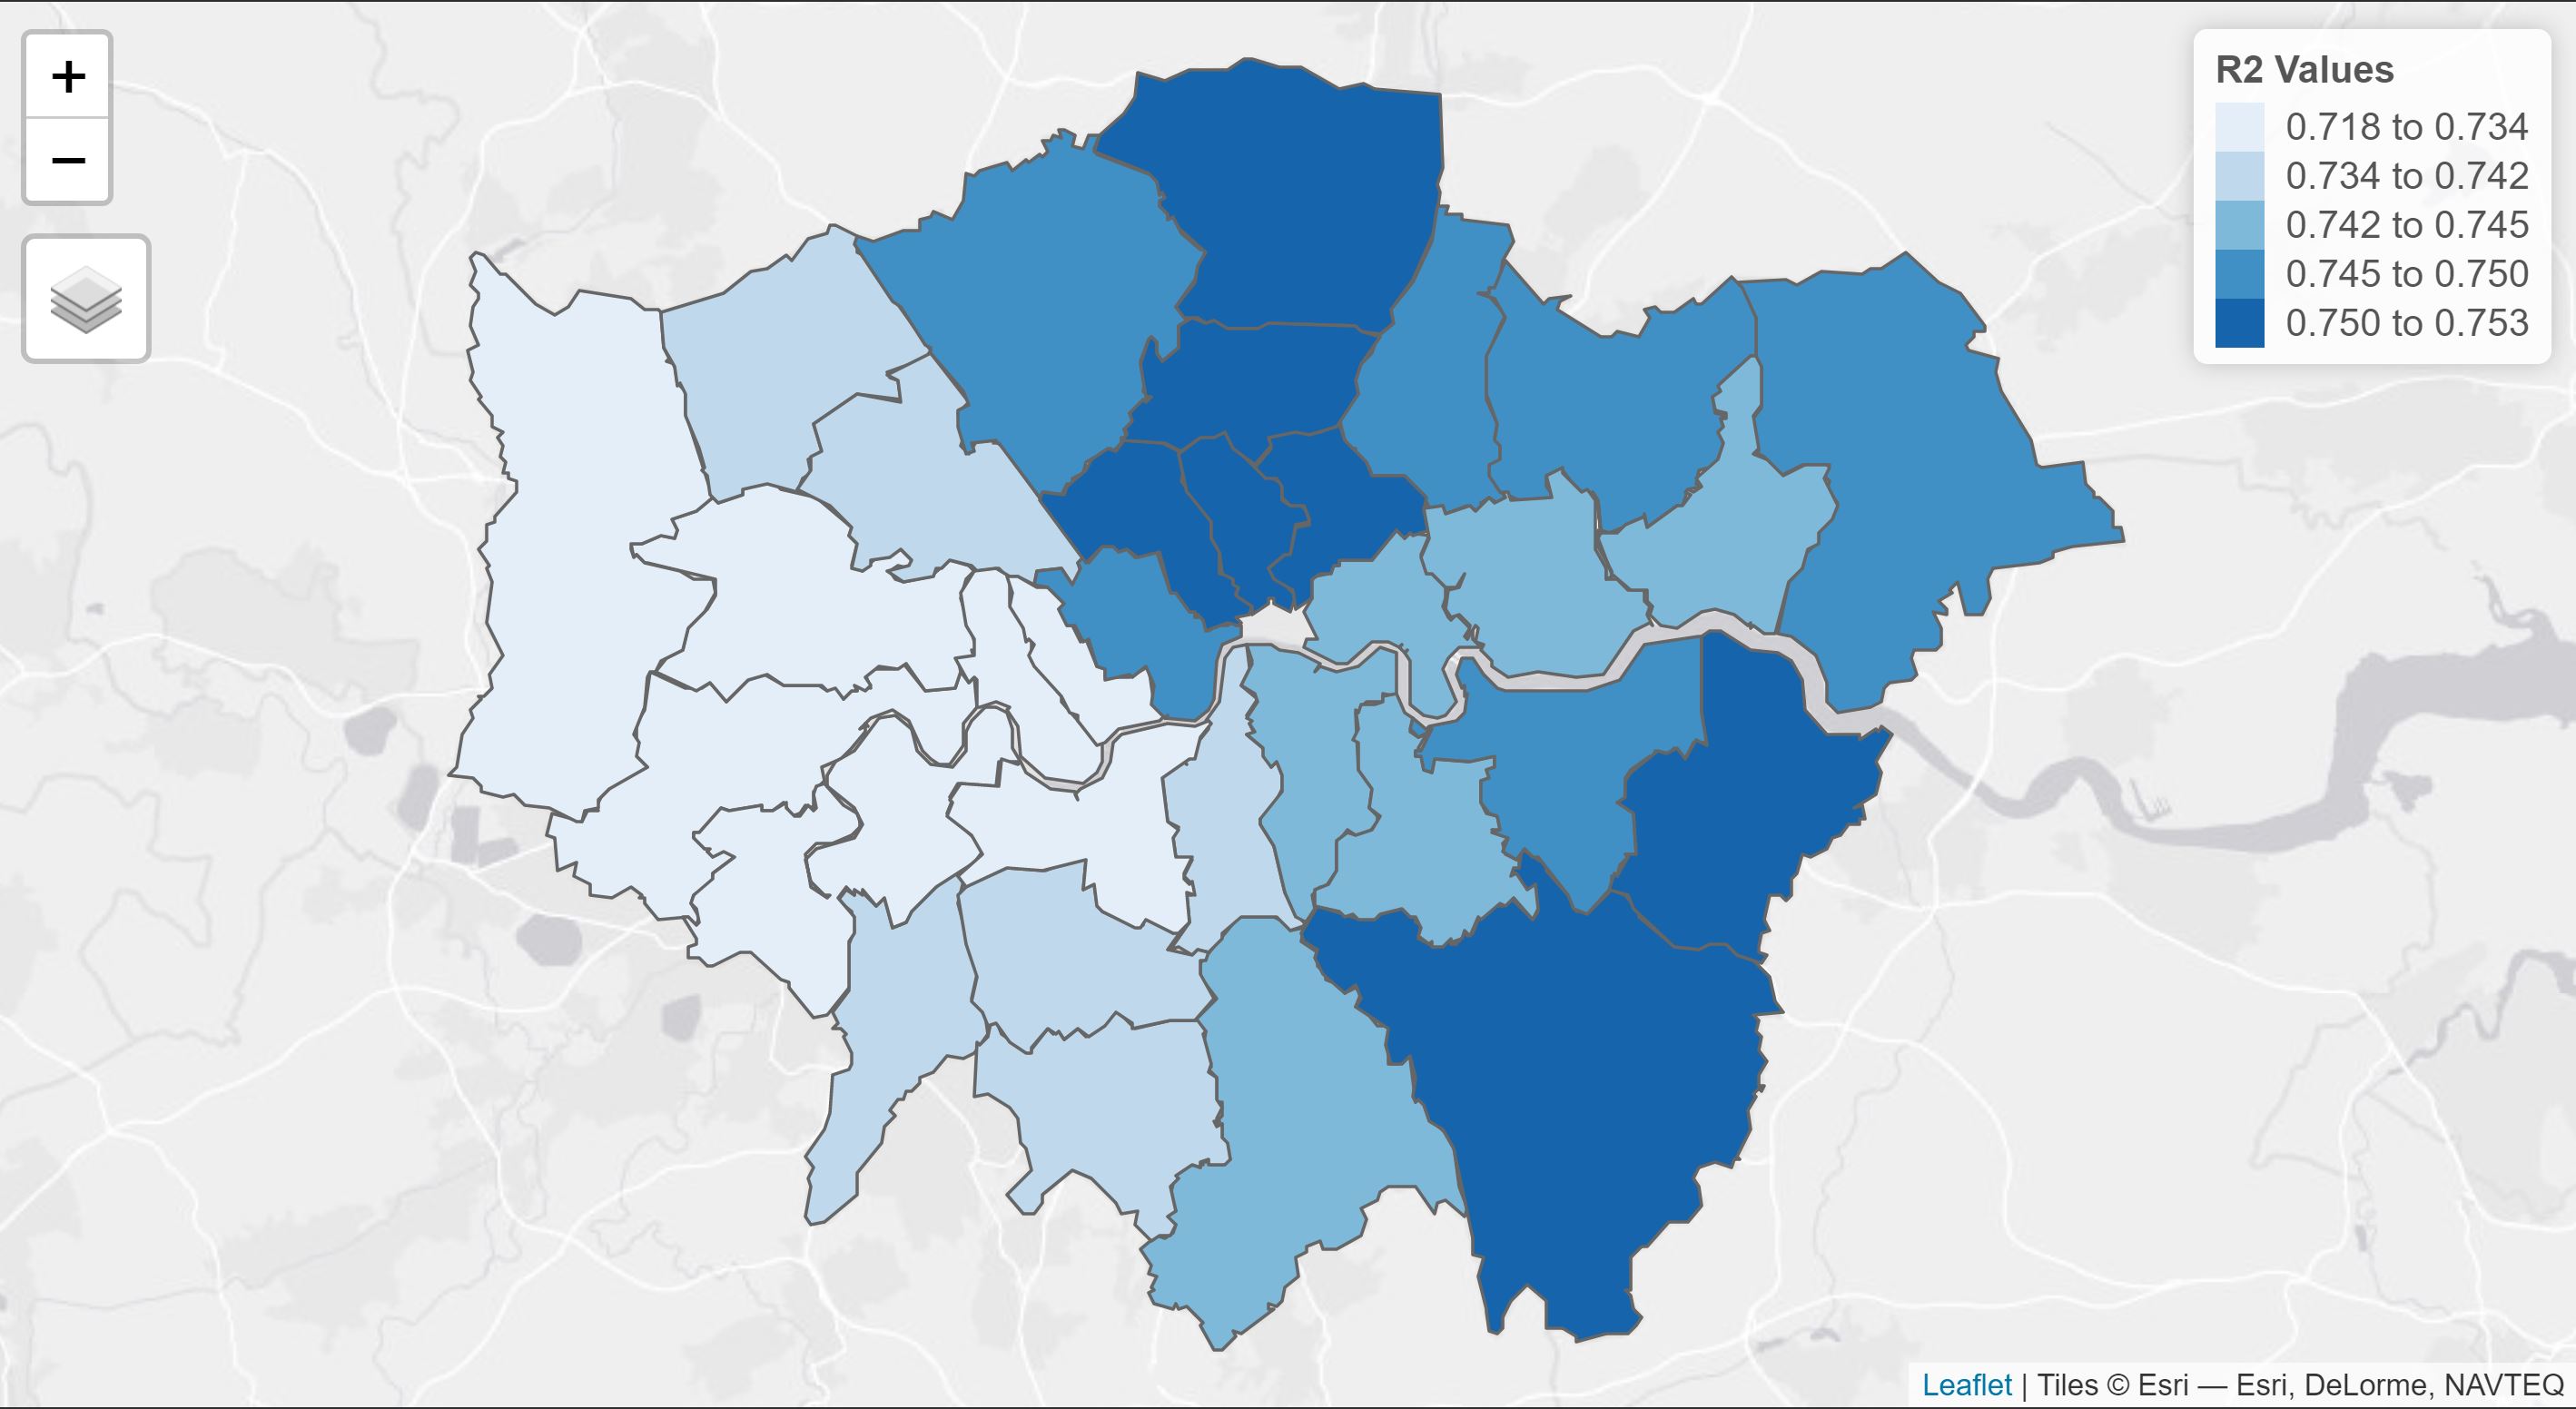
Analysis of Crimes in London -Geographically Weighted Regression Modelling
This report is a sub-module of the bigger Shiny-based Visual Analytics Application (Shiny-VAA) project under ISSS608 Visual Analytics.

DataViz Makeover 3
This post critics and provides alternative graphical presentation by using data from Armed Conflict Location & Event Data Project (ACLED). The South-east Asia dataset is taken from https://acleddata.com/data-export-tool/.
My First R Markdown Document
A new article created using the Distill format.

Project Proposal
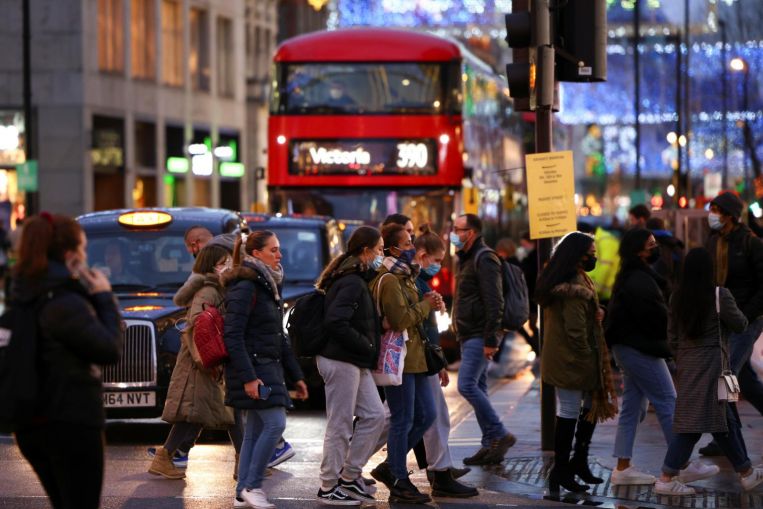
The Prime Crime Area Spatio-Temporal Analysis
Dataviz Makeover 2
This post critics and provides alternative graphical presentation by using data from Imperial College London YouGov Covid 19 Behaviour Tracker Data Hub hosted at Github. The datasets are taken from https://github.com/YouGov-Data/covid-19-tracker

DataViz Makeover 1
This post critics and provides alternative graphical presentation on a data visualisation from an extract of the annual report on Singapore’s labour market by Ministry of Manpower. The datasets taken are Table 5 and table 7 from https://stats.mom.gov.sg/Pages/Labour-Force-Tables2019.aspx
Welcome to VIZ
Welcome to our new blog, VIZ. We hope you enjoy reading what we have to say!